Stock Analysis
In this Topic ShowHide
Introduction
The stock analysis applies color schemes to the stock material which
allows you to analyze the stock after operations are performed in simulation.
Stock Analysis Buttons
The following four buttons display at the top of the Stock Analysis
tab in the simulation window. Not all buttons are available for all Stock
Analysis options, and some of them change their use depending on which
Stock Analysis option you select.
 Refresh Cutsim -
updates the stock model in the simulation window to the currently selected
Stock Analysis option and colors. You should click Refresh anytime that
you change a Stock Analysis parameter such as the colors used. When the
analysis is current, this button changes to
Refresh Cutsim -
updates the stock model in the simulation window to the currently selected
Stock Analysis option and colors. You should click Refresh anytime that
you change a Stock Analysis parameter such as the colors used. When the
analysis is current, this button changes to  .
.
 Auto Adjust or
  Min/Max Detection - updates the
Stock Analysis in one of two ways. For most Stock Analysis options, this
resets the analysis colors to their default values. When using the Deviation
option, this button analyzes the minimum and maximum amount of deviation
in the cut model versus the workpiece, and then updates the Start and
End values in the Stock Analysis tab.
Min/Max Detection - updates the
Stock Analysis in one of two ways. For most Stock Analysis options, this
resets the analysis colors to their default values. When using the Deviation
option, this button analyzes the minimum and maximum amount of deviation
in the cut model versus the workpiece, and then updates the Start and
End values in the Stock Analysis tab.
Match Tool Flute Color with Cutting Color
When you are using either the Tool Number or Operation Number analysis
options, the following button becomes available.
 Match Tool
Flute Color - displays the tool flute in the same color as the
current tool or operation color that is defined in the Stock Analysis
tab. So as the simulation runs, the tool flute color changes to match
each operation or tool number color.
Match Tool
Flute Color - displays the tool flute in the same color as the
current tool or operation color that is defined in the Stock Analysis
tab. So as the simulation runs, the tool flute color changes to match
each operation or tool number color.
Stock Analysis Options
The Stock Analysis can be turned off by selecting None. When you turn
off the Stock Analysis, the stock material displays only in the defined
stock color. All other Stock Analysis options are described next.
Tool Number or Operation Number
The toolpath
is colored after the different tools or operations being used.
Main benefit
Identify the amount of different tools or operations
being used.
Identify the area a certain tool is performing a machining
(roughing, finishing etc.).
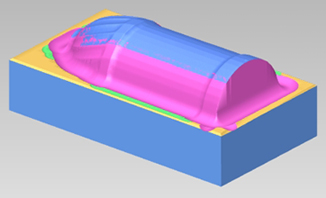
Example
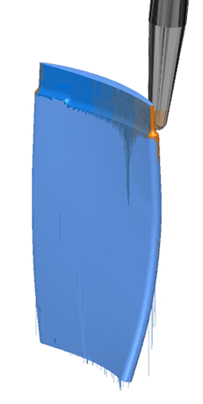
The following picture shows a machining of a bottle. The material is
colorized after the different tools being used. As you can see there are
four different tools (or operations) used for the machining.
Deviation
The deviation
is a material offset compared to the target geometry. The color of the
material changes the more or less material exists on top of the target
geometry.
Main benefit
Identify the amount of the material left on the target
geometry.
Identify the gouges, when too much material was removed
and the target geometry is being damaged.
Identify area where a rest machining is necessary.
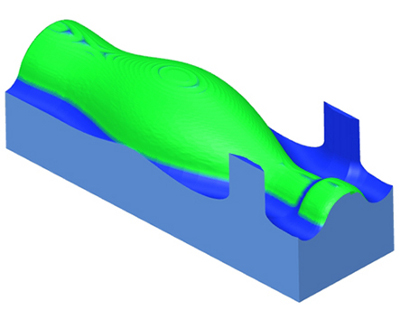
Example
The following picture shows a machining of a bottle. The colorization
is from green (min. material left) to blue (max. material left). You see
two significant results:
Due to the step over of the machining big cusps are
left on the machining surface (left side).
The tool used was too big to get into the area between
the bottle neck and bottle head. A rest machining is necessary.
Height Change
The height
change indicates whether the tool is ascending or descending.
Main benefit
Identify if there are plunge motions in the material.
In this case the tool must be able to perform plunging.
Identify the cutting method, Zig Zag or OneWay.
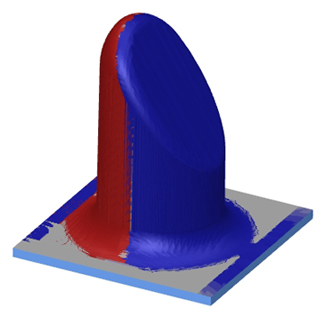
Example
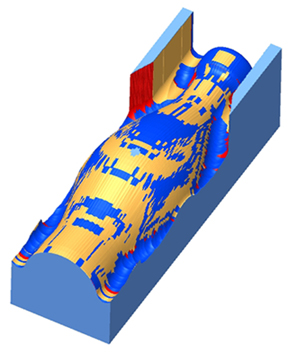
The following picture shows a machining of a male formed part. The colorization
is red (for plunging) and blue (for retracting). The machining is OneWay,
starting from one side going to the other side.
Orientation Change
The material
is colorized after the orientation change of the machines rotation axis.
Main benefit
Identify the rotation speed range being used.
Identify under which rotation speed a certain area
is machined.
The rotation speed gives feed back where machine speed
limits are reached and where you can expect stability issues of the
process which influences the final surface quality.
Example
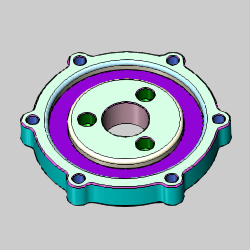
The following picture shows a machining of a turbine blade. The colorization
is from blue (low rotation speed) to orange (high rotation speed). You
see that especially in the small corner radius the orientation speed is
high. The quality in this area could suffer.
Toolpath Length
The toolpath
length indicates the length of the toolpath segments.
Main benefit
Example
The following picture shows a machining of a bottle. You see that the
toolpath length varies in certain areas. The toolpath points are not equally
distributed.
Mark Parts
The part is colorized into chips which
have been separated from the main part.
Main benefit
Example
The following picture shows the part after machining. It is divided
into two parts now.
Single Marking
The Single Marking analysis option displays all cut material using the
same color. You can double-click the small color box, next to Color for
Cut Material, to select the desired color. To update the model after selecting
this option, click Refresh. This option is useful when you want to view
all cut material in a single color. This option can also be used when
taking screen shots of the stock material.
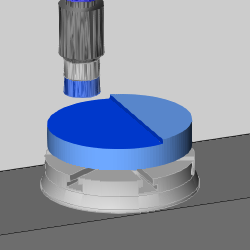
Example
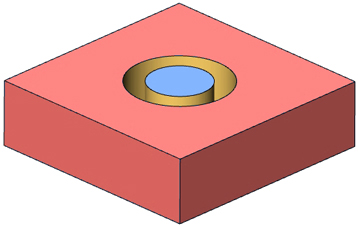
The following image shows a stock model with Operation Number analysis.
After selecting the Single Marking analysis option, selecting a color,
and then clicking Refresh, the stock model appears as shown next.
Gouge Excess
The gouge and excess stock analysis option displays three colors to
represent the gouging, within threshold/tolerance, and excess material
areas of the cut stock in the simulation window. If you make any adjustments
to the colors or settings for the gouge and excess option, click the refresh
button to update the cut stock in the simulation window.
Related Topics
Getting Started With
Simulation