


 Measure Two
Introduction
This topic will explain the Measure Two function, describe where to find it, and the optionsfound in it.This topic will also provide quick steps and an example on how to use it, and provide links to related topics.
The Measure Two Function
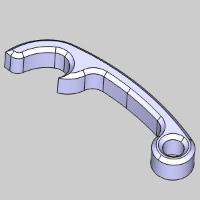
The Measure Two function measures various dimensions of, or spaces between,two selected entities.To perform the function, you select the entitiesto measure, and the Measure Entity dialog box displays all the availabledimensions.Measuring particular entities will present you with flagsfor each available measurement in the graphics area.The entities thatpresent the graphical representation in the graphics area are as follows:
|
Entity1 |
Points |
Arcs |
Splines |
Lines |
|
Entity 2 |
Points Lines Arcs Splines |
Arcs Points Splines |
Points Arcs |
Parallel Lines |
Along with wireframe entities, it is alsopossible to measure the edges and snap points of solid models.These behavethe same way as their wireframe counterparts.
Navigation
To open Measure Two:
- In the Measure group, of the Evaluate ribbon, click
 Measure Two.
The Data Entry Parameters
First Entity
|
|
|
| The list box will list the entity currently selected for the function. | |
Second Entity
|
|
|
| This list box will show the entity currently selected for the function. | |
- Cancel - cancels the functionwhen finished.
Quick Steps - Measure Two
- Open the function.
The First Entity list automatically has focus. - Select the first entity.
The geometry is added to the First Entity list, and the Second Entity list is automatically given focus. - Select the second entity.
The measurements appear. - With the preview showing the desired result, click OK.
- Repeat as necessary.
- Click Cancel to close the function.
Tip: Certain measurements will display on flags in the graphics area.The position of these flags can be adjusted by clicking once on the colored area, and again to place the flag.
Example
Part 1) Opening the Measure Two Function
-
In the Measure group, of the Evaluate ribbon, click
Measure Two.
The Measure Two parameters display in the Data EntryManager.
Part 2) Selecting the First Entity
The Measure, Two Entities function has two main steps; select the firstentity, and select the second entity.When selecting lines or straightedges, it is good practice to select snap points to specify which pointof the line or edge is to be measured from.
-
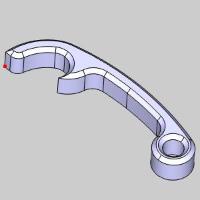
In the graphics area, hover over the entityas shown in the image below.
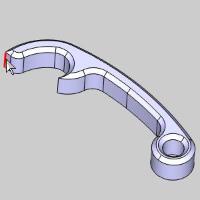
The entity highlights for a moment, and then the snap points appear.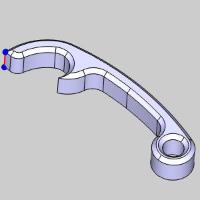
-
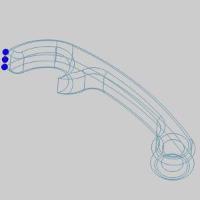
Hover over the snap point shown in the image below.
The snap point highlights. -
Click the snap point.
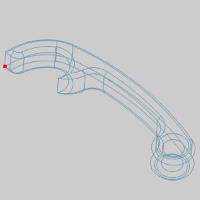
The first Entity highlights, and is added to the First Entity list.
Part 3) Selecting the Second Entity
In the same manner the first entity was selected, we will now selectthe second entity.
-
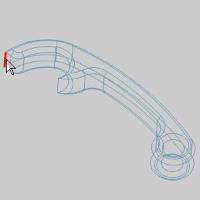
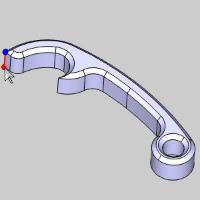
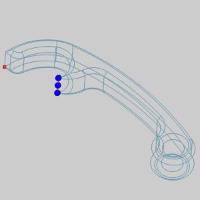
In the graphics area, hover over the secondentity as shown in the image below.
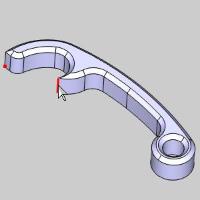
The second entity highlights for a moment, and then the snap points appear.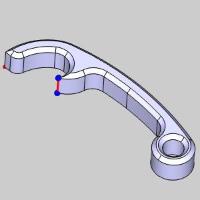
-
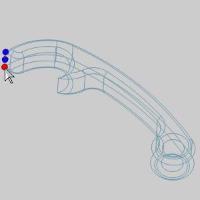
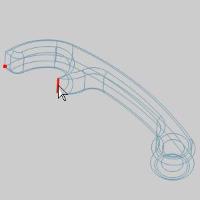
Hover over the snap point shown in the image below.
The snap point highlights. -
Click the snap point.
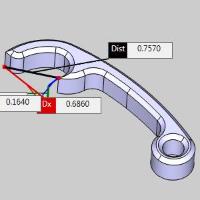
The point is added to the Second Entity list, the Measure Entity dialog box displays in the Measure Entity Manager,and the measurements display in the graphics area.The Measure Entitydialog box may need to re-sized in order to view make all the informationvisible.Otherwise, you can click the title bar (that displays MeasureEntity), and drag the window to any other location in the user interfaceif you prefer.You can also click and drag the separator between theProperty and Value columns to better view the descriptions.
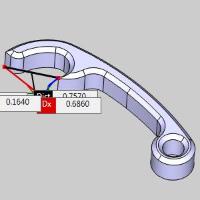
Part 4) Adjusting the Position of Measurements in the Graphics Area
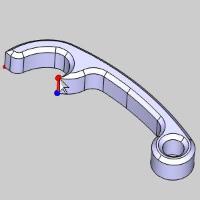
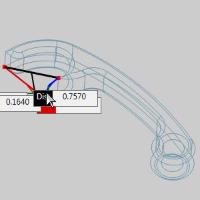
When the measurements initially display in the graphics area, all ofthe data may not be visible.Zooming in and out will have an effect, butit may be desirable to adjust the position of the individual flags.
-
In the graphicsarea, click on the black Distflag as shown in the image below.
The Dist (Distance) flag moves to the front.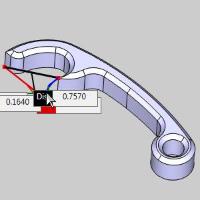
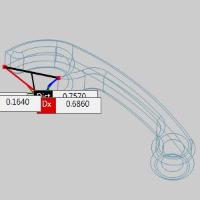
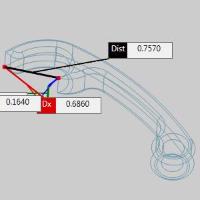
-
Move your mousein the graphics area and notice the Dist flag move with it.
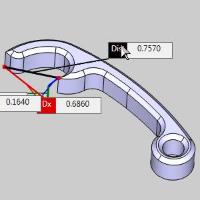
-
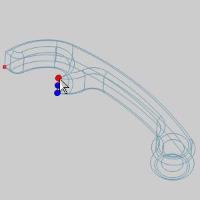
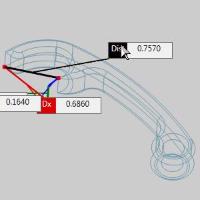
Click againin the graphics area to place the flag.
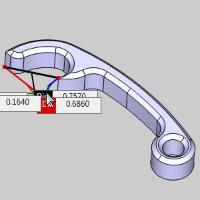
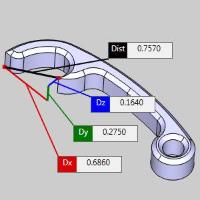
-
Repeat as necessary withthe other flags.
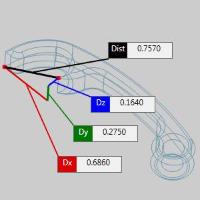
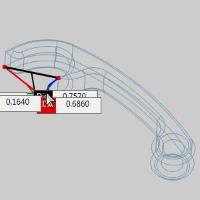
Part 5) Canceling the Measure Two Entities Function.
The measurement data visualized as flags in the graphics area, disappearas soon as the function is canceled.The data in the Measure Entity dialogbox remains until another measurement is taken, or the dialog is closed.
-
Click Cancelin the Measure Two function in the Data Entry Manager.
The measurement flags in the graphics area disappear.
Notice the measurement information contained in the Measure Entitydialog box remains.
This concludes this example.