Beginning Debugging
The aim of this topic is to walk you through some of the basic steps of understanding how to utilize the MoonSharp Debug extension from within Visual Studio Code to understand how to debug your Lua scripts written for a BobCAD-CAM product.
Don't forget that sometimes just displaying a value or two in a message box during program execution can also be one of the fastest ways to do some quick debugging!
Step 1 - If you didn't just come from the Initial Setup topic
For those of you who didn't just come to this topic right after reading the Initial Setup topic and don't have anything running currently, we are going to start from here. If you have just finished the Initial Setup topic and you have VS Code already running with your LuaPlugins folder loaded then skip to Step 2 now!
With your BobCAD product closed, open up Visual Studio Code and load your \BobCAD-CAM Data\<BobCAD Product>\LuaPlugins\ folder into VsCode.
Next, start your BobCAD product.
Step 2 - Start the debugger
Upon starting your BobCAD product with the registry key set enable debugging, you will be presented with this dialog:
Before clicking OK, this is the point in time where you want to start the debugger in Visual Studio Code by choosing Run > Start Debugging as seen below:

After you start debugging, the Debug Console should be displayed in Visual Studio Code.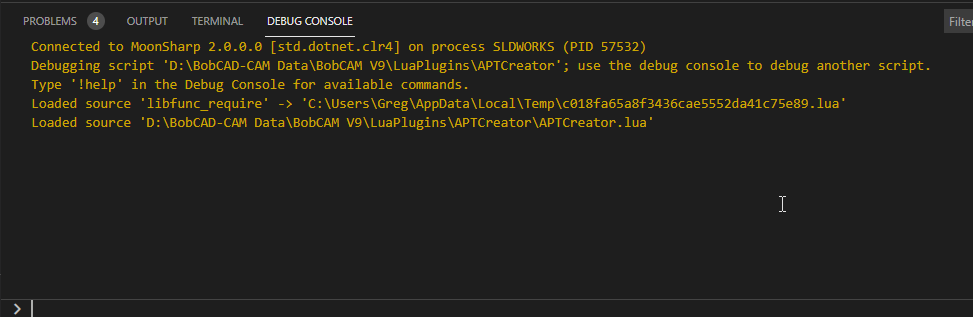
This message information comes from the MoonSharp debugger extension, and it is important to remember that you can always use !help in the console to see the list of available commands.
The important lines to point out in this data is line 1, 2 and 5:
Line 1: What process is acting as the MoonSharp debug server. In the above example image I am utilizing the BobCAM for SolidWorks product inside Solidworks 2021 which is why you see the process is SLDWORKS.
Line 2: The plug-in which is loaded to debug.
Line 5: Lua file which is loaded for debugging.
Step 3 - Set which Lua file you are debugging
Two commands you will get familiar with very quickly are:
!list - shows a list of of all the plug-ins available on your system to debug
!switch <id> - allows you to switch which plug-in you are debugging by providing the index supplied with the !list command
So let's go ahead and type !list into the Debug Console and press enter. You will see something similar to the image below depending on what plug-ins you have in your LuaPlugins directory.
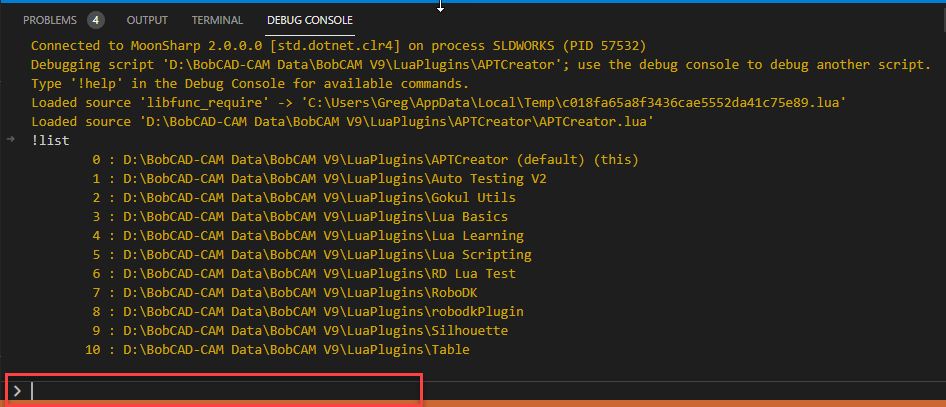
You can see above after calling the !list command, I am shown the 11 plug-ins I have on my system.
So let's assume I am actually wanting to work on my plug-in in the folder named robodkPlugin, so you can see on my system that is item 8 from the list.
So next we need to type !switch 8 into the debug console to tell the system you are wanting to debug the files inside the robodkPlugin folder.
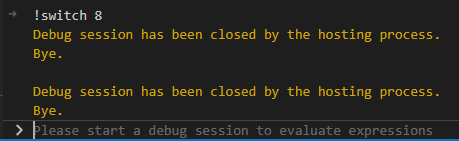
You will see a message about the active debug session being closed. So lastly now that we have switched which plug-in we want to debug, we just simply need to start the debugger again by going to Run > Start debugging in Visual Studio Code. Once you get the hang of it, you will most likely just start using F5 shortcut to start debugging.
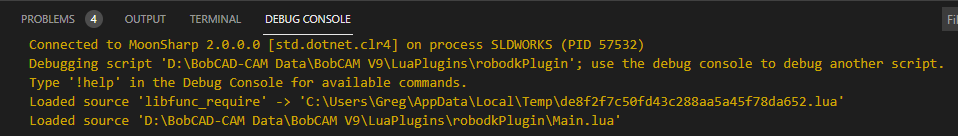
Now I am setup and ready as shown in the below image to debug my robodkPlugin plug-in scripts!
Step 4 - Click OK to launch BobCAD product
On this dialog that is still hovering on your desktop, now you can comfortably press OK to launch the software!