Toolpath Analysis
Introduction
This topic explains the Toolpath Analysis Tab and the options found in it. This topic will also provide links to related topics.
The Toolpath Analysis Tab
The toolpath analysis applies colorization schemes to the toolpath display in the simulation window to help you to better analyze the programs you create.
Note: This topic describes all of the analysis options that are available in the Toolpath Analysis tab. These options change depending on the program that you are simulating. For example, when simulating a 3-axis program, none of the Rotation Axis Analysis options display in the list. The list of Toolpath Analysis Schemes is dynamically updated with the appropriate options based on the current program.
Toolpath Analysis Buttons
Some or all of the following buttons display in the Toolpath Analysis tab depending on which analysis scheme you are using. If any button is unavailable, then it does not apply to the selected analysis scheme.
![]() Refresh
- updates the toolpath analysis scheme after making changes such as adding
another color or modifying the analysis settings.
Refresh
- updates the toolpath analysis scheme after making changes such as adding
another color or modifying the analysis settings.
![]() Add - is
used to add another color to the analysis scheme (sequence, orientation
change, segment length, tool axis change analysis schemes).
Add - is
used to add another color to the analysis scheme (sequence, orientation
change, segment length, tool axis change analysis schemes).
![]() Remove -
is used to remove the selected color from the analysis scheme (sequence,
orientation change, segment length, tool axis change analysis schemes).
Remove -
is used to remove the selected color from the analysis scheme (sequence,
orientation change, segment length, tool axis change analysis schemes).
![]() Adjust -
is used to adjust or modify certain analysis settings, such as the threshold
angle for the linear axis reversal analysis scheme or minimum and maximum
segment lengths for the segment length scheme. This button is only available
when the selected scheme has adjustable parameters.
Adjust -
is used to adjust or modify certain analysis settings, such as the threshold
angle for the linear axis reversal analysis scheme or minimum and maximum
segment lengths for the segment length scheme. This button is only available
when the selected scheme has adjustable parameters.
![]() Auto Adjust
- is used to adjust the analysis settings to the default values based
on the selected scheme.
Auto Adjust
- is used to adjust the analysis settings to the default values based
on the selected scheme.
Tool Number and Operation Number
The toolpath is colorized after the different tools or operations being used.
Main benefit
-
Identify the amount of different tools or operations being used.
-
Identify the areas in which a certain tool is cutting.
Example
The following picture shows a machining of a bottle. The toolpath is colorized after the different tools or operations being used. As you can see there are four different tools or operations are being used.
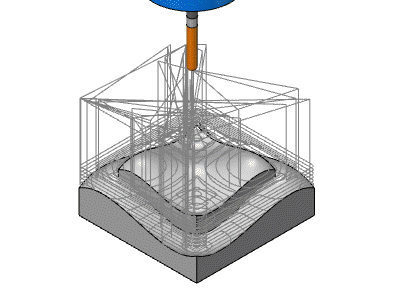
Operation Highlight
The toolpath will be colorized depending on whether is from the current operation or from other operations.
Main benefit
- Identify the toolpath for the current operation or if it is part of other operations
-
Identify the area a in which the current operation is performing machining.
Operation Selection represents the current operation and other operations given in the CAD/CAM system.
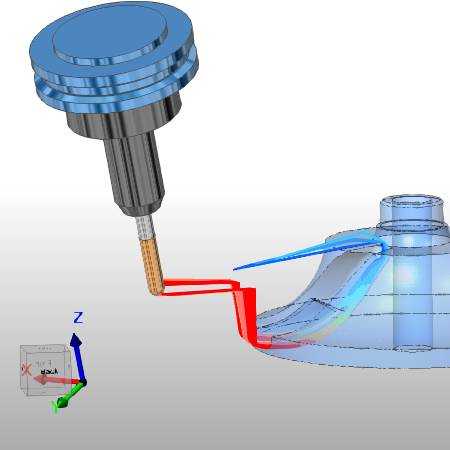
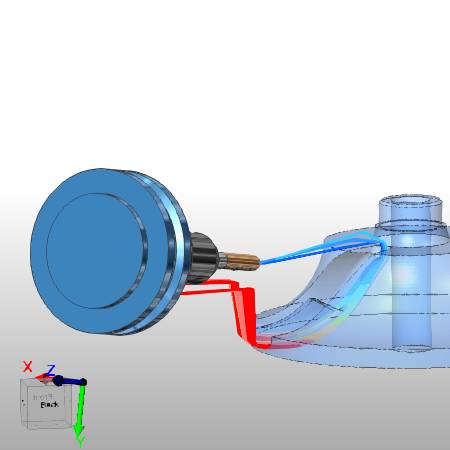
Example
The following picture shows toolpath in two colors. One color for the current operation, and another color for the other operations.
Sequence
The toolpath is colorized in a hot to cold gradient.
Main benefit
-
Identify start point and the end point of the machining.
-
Identify the cutting method (if ZigZag or OneWay).
-
Identify the cut order (from inside to outside, from outside to inside).
Example
The following picture shows a machining of a half sphere. The sequence is from red to blue. You can see from the colorization the toolpath starts outside and ends in the middle of the sphere. Also, it is performed in a Oneway.
Rotation Axis Value
The toolpath will be colorized based on the tilt angle of the machines rotation axis. The coloring of the toolpath is done based on angle intervals.
Main benefit
- Identify the rotation axis angle range being used.
- Identify under which rotation angle a certain area is machined.
- Identify limit overruns.
Start value - represents the starting value for the interval that will have the specific color
End value - represents the end value for the interval that will have a specific color
Example
In the following images, you will see a part being machined in simulation, and a color change in the toolpath being cut. This is due to the assigned axis value colors.
Rotation Axis Value Change
The toolpath will be colorized after the tilt angle of one (A, B, or C) of the machines rotation axis value changes. The coloring of the toolpath is done on angle intervals.
Main benefit
- Identify the rotation speed range being used.
- Identify under which rotation speed a certain area is machined.
- The rotation speed gives feed back where machine speed limits are reached and where you can expect stability issues of the process which influences the final surface quality.
Start value - represents the starting value for the interval that will have the specific color.
End value - represents the end value for the interval that will have a specific color.
Rotation Axis Reversal
The toolpath will be colorized after rotation axis reversals. So every time a when the rotation axis changes the direction the toolpath segment will change the color.
Main benefit
- Identify the area where possible contouring errors have negative influence on the machining result, surface quality
Example
The following picture shows a machining of a half sphere. You see that in the middle of the machining the rotation axis performs a reversal.
Rotation Axis Speed
The toolpath will be colorized after the intervals for rotational axis speed.
Main benefit
- Identify the rotation speed range being used.
- Identify under which rotation speed a certain area is machined.
- The rotation speed gives feedback where machine speed limits are reached and where you can expect stability issues of the process which influences the final surface quality.
Linear Axis Reversal
The toolpath is colorized after linear axis reversals. A reversal can be defined by a threshold angle. The default is 150 degrees. So every time the linear axis changes the direction 150 degrees or more, the toolpath segment is colorized red.
Main benefit - Identify the area where possible axis reversal could have negative influence on the machining result or surface quality.
Example
Due to the pattern, in some areas the toolpath changes its direction instantly.
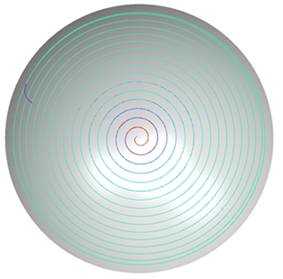
Orientation Change
The toolpath is colorized after its orientation change angle between 2 segments.
Main benefit - Identify the curvature of the toolpath. Find the areas where the toolpath is fluent and smooth, or areas where it is edgy, where errors can have negative influence on the machining result or surface quality.
Example
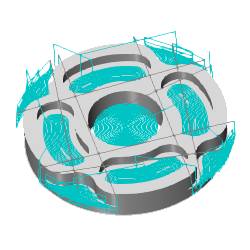
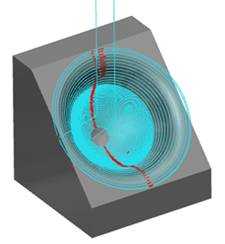
The following picture shows a machining of a concave shaped surface. The toolpath is a spiral motion. Accordingly, in the middle the radius is small so the orientation change is big. The more the toolpath proceeds to the edge, the orientation change becomes less.
Segment Length
The toolpath is colorized after the length of the segments.
Main benefit - Identify the areas where you have long linear motions, usually in roughing toolpath or where the segments become very short, for example, for finishing.
Example
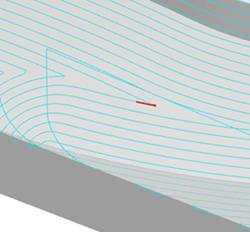
The following picture shows a machining of a concave shaped surface. The toolpath is a spiral motion. The segment lengths (between points) are colorized, by default, from green (smallest) to blue (largest).
Collisions and Proximity
The toolpath is colored as the tool cuts based on one of four statuses:
-
Grey means that the toolpath is not yet checked.
-
Green means that the toolpath is checked and it is collision and proximity alert free.
-
Red means that the tool is colliding with the geometry.
-
Yellow means that the toolpath is within the proximity alert area, which means it was close to a collision but didn't actually collide
Note: When using this analysis option with Material Mode selected, you must turn on the Collision and Proximity option in the Verification Process tab of the Simulation Properties dialog box.
Example
The following animation shows a machining of a random surface. You see the toolpath changes from gray (not checked) into green (checked and collision and proximity alert free).
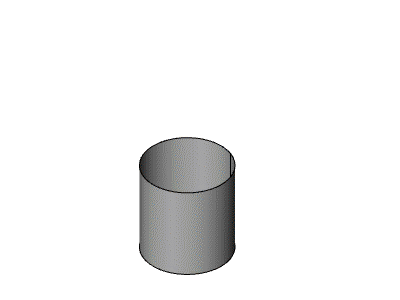
Feedrate
The toolpath is colorized after the feedrate.
-
Blue means that the toolpath has machining feedrate.
-
Yellow means that the feedrate is rapid rate.
Example
The following animation shows a machining of a cylinder. You see the first entry and the last exit have travel with rapid feedrate.
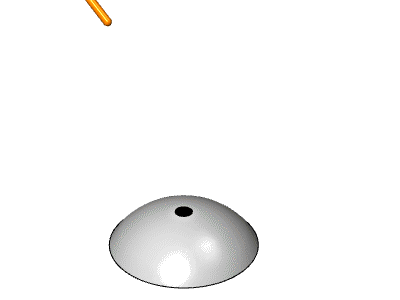
Height Change
The toolpath is colorized after its orientation of the tool relative to the toolpath. The colors are indicated next.
-
Red - Plunge in tool axis direction.
-
Orange - Lag angle orientation of the tool (pushing).
-
Grey - Normal orientation.
-
Light green - Lead angle orientation of the tool (pulling).
-
Green - Retracting along tool axis.
Main benefit
-
Identify if the tool is plunging into the part along its tool axis or with an angle.
-
Identify if the tool is being pulled or pushed.
-
Identify if the tool is retracting from the part along its tool axis or with an angle.
Example
The following animation shows a machining of a convex shaped surface. The toolpath is a single motion. You can see the different orientations of the tool relative to the toolpath.
Axis Pole
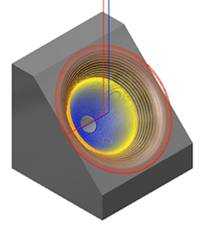
The toolpath will be colorized to determine if the 2 rotation axes are collinear. The color scheme reaches from blue to red. As the tool angle becomes closer to being collinear with the rotation axis the toolpath becomes red.
Example
In this example, you can see as the tool axis is close to being collinear with the rotation axis, the toolpath is red. As the tool axis moves away from being collinear, the toolpath is blue.
Single Marking
The Single Marking analysis option displays all toolpaths using a single color. After selecting the Single Marking option, you can double-click the small color box, next to Color for Toolpath Line, to select a different color than the default.
Main benefit
This is useful when you want to view all toolpaths in a single color, or for example, when taking screen shots of the toolpath from the simulation window.
Example
The following image shows a program with multiple operations and the toolpath analysis is set to Single Marking.