Getting Started With Simulation
Introduction
This topic will provide an overview of the Simulation, describe how to access it, and provide links to the individual topics covering the Simulation.
Simulation
Program simulation in BobCAM is an extremely powerful tool that provides many options for viewing and verifying the machining operations of your CAM jobs. You can simulate viewing the tool, stock, workpiece, and with Machine Simulation Pro, even a virtual machine.
The machining simulation is visualized in two main simulation-modes and three simulation-focus options.
-
The modes are predefined sets of items displayed in the simulation window. The modes help you examine the two main components of the simulation: toolpath backplot mode or material removal mode.
-
The focus determines what items display in the simulation window and how the movement is performed. The focus can be set to Workpiece/Stock, Machine, or Tool.
The simulation always uses a combination of one mode and one of each display type. This gives quick access to one of the simulation components with only the necessary elements on the screen. Select the combination from the following modes and display modes.
Navigation
To open simulation, do one of the following:
-
In
the BobCAM menu, or on the BobCAM Command Manager tab, click
 Simulation.
- Right-click
 Milling Job, or the current job
folder, in the CAM Tree and click Simulation.
Milling Job, or the current job
folder, in the CAM Tree and click Simulation.
Note: You must have toolpath computed, and set to Post Yes, or simulation will not launch.
The simulation window displays.
Tip: If you install a new machine by copying it to your MachSim folder with the software closed, you can open the software, open a file which uses that machine and immediately simulate. However if the software is already open when the machine is copied to your MachSim folder opening a file which uses the new machine will show the error: The machine used in this job does not exist in the system. Please choose a machine from the Job Current Settings. To correct this, simply right-click CAM Defaults and select Current Settings. Once the dialog opens, just click OK. The list of machines in the MachSim folder is now refreshed and the simulation can be run!
The Simulation Window
The simulation window is where you observe the machining process.
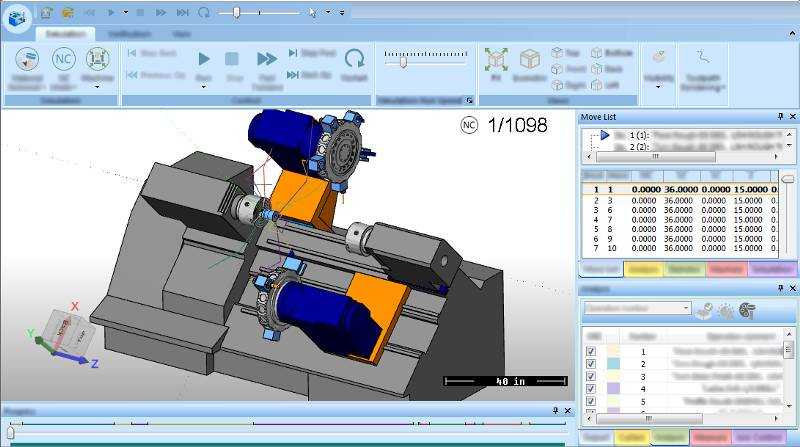
The Ribbon Bar
The ribbon bar tabs at the top of the simulation window provide the commands needed to run (play) the simulation as well as defining the view orientation and status of all elements in the simulation window (such as the workpiece, fixture, stock, tool, machine, and toolpath).
Tip: You can click the small arrow on the far right side of the ribbon bar to minimize the ribbon bar so that it only displays the tab names, which can still be accessed by clicking the tab name.
The File Tab
The File tab of the ribbon bar contains many simulation preferences and settings as explained in the File Tab topic.
Note: Depending
on the selected ![]() .
Click either of these to access the File tab based on the current style.
.
Click either of these to access the File tab based on the current style.
View the File Tab topic to learn about:
- Simulation Information
- Saving stock, creating simulation presentations, creating a simulation report (XML file)
-
Options
- Simulation Properties
- Verification Properties
- Graphics and Background
- Customize the User Interface (includes keyboard and mouse shortcuts)
- Quick Access Toolbar
The Simulation Tab
The Simulation tab contains some of the most used controls for selecting simulation modes, focus, views, visibility, playback speed, and toolpath rendering options. To learn more, view the Simulation Tab topic.
View the Simulation Tab topic to learn about:
- Viewing mode, playback mode, simulation focus
- Playback controls and run speed
- Viewing controls
- Visibility settings
- Toolpath visibility settings
The Verification Tab
The Verification tab contains options for reporting gouges as well as the refine options. To learn more, view the Verification Tab topic.
View the Verification Tab topic to learn about:
- Gouge and Excess display and reporting
- Refining the view of the stock model to better show results
- Resetting the refined view
The View Tab
The View tab contains buttons that allow you to hide and show the analysis and information tabs from the simulation interface. To learn more, view the View Tab topic.
The Quick Access Toolbar
The Quick Access Toolbar is designed to provide fast access to some of the most used buttons in the simulation interface. You can click the down arrow to the right of the Quick Access Toolbar to access the Customize Quick Access Toolbar menu. You can also customize the Quick Access Toolbar in the Machine Simulator Options dialog box to determine what buttons display here.

The Progress Bar
The Progress Bar near the bottom of the simulation window displays the current position of the program and shows the number of operations with a color coded bar above the progress slider. You can drag the slider to different locations to navigate the program manually. The bars below the slider also display red segments in the event there is a collision/gouging in the program.

Analysis and Information Tabs
The Analysis and Information tabs that display on the right side of the simulation window are used to access the many extremely powerful simulation tools, such as the Toolpath Analysis, Stock Analysis, the Move List, and many others.


To learn about the analysis and information tabs, click the following links.
Cutsim (includes Save Stock and Sectional View)
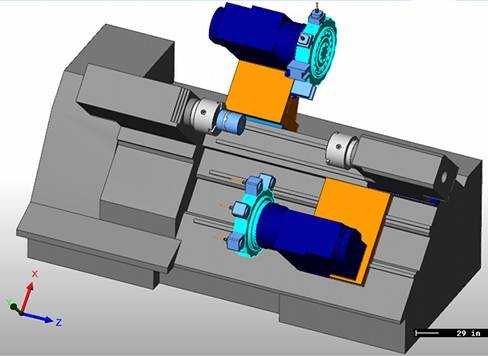
The Machine Model (Machine Simulation Pro)
For customers that have purchased the full machine simulation, you can add geometry (.stl) files to define all of the machine elements that display in the simulation window. This is extremely beneficial, for example, for multiaxis customers that need to confirm that all machine movements during the program are collision free.
To learn about defining your machine, view the Current Settings Default and How to Create a Machine.
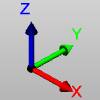
Coordinate System Gnomon / Rotation Cube
The gnomon displays in the lower-left corner of the simulation window to represent the orientation and direction of X, Y, and Z axes. The visibility and location of the gnomon can be selected from the File tab under Options.
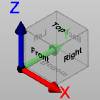
The Rotation Cube will allow you to click on a face of the cube to shift to the Top, Bottom, Right, Left, Front, and Back views. Clicking on the corners of the Rotation Cube will allow you to shift into the various isometric views.

Ruler
The ruler that displays in the lower-right corner of the simulation window can be used for measuring and evaluating different distances. The value displayed on this bar shows the real length of the bar, and it is updated by each movement. So anything in the simulation window with the length of this bar has the dimension of the displayed value. In addition to the ability to turn on and off the display of the ruler, you can also select the location at which it displays from the File tab under Options.

Workpiece Center Point
The display of the workpiece center point can be turned on or off from the File tab under Options.

Machine Center Point
The display of the machine center point can be turned on or off in from the File tab under Options.
